ProBee dashboards in Grafana

Predictive protocol assurance ProBee

ProBee is a protocol-level probe that reads live network traffic, keeps full dialogue state, and turns it into predictive Protocol Experience (PX) metrics. It finds the degradation that precedes an incident — and it does it inside the observability stack your operations team already uses.

  • Analyses millions of packets per second, scaled horizontally
  • Understands legacy and 5G core protocols in the same pipeline
  • Detects traffic anomalies before they become incidents
  • Publishes to Prometheus, Kafka, SNMP and Grafana — no proprietary console
  • Deploys as a hardware tap, a port-mirror collector or a pod in your cluster

SS7 / SIGTRAN

MAP

CAMEL

INAP

Diameter

SIP

SMPP

MM1–MM9

HTTP/2 SBI

GTP-C

PX metrics

Anomaly detection

Prometheus

Kafka

SNMP

Grafana

Kubernetes

What ProBee actually measures

Most monitoring counts messages. ProBee reconstructs conversations. It correlates request and response across a dialogue, measures latency and outcome per transaction type, and attributes every anomaly to a peer, a route, a node and a service.

Protocol Experience (PX) is the composite score that comes out of that: a continuous, per-service quality index derived from success ratio, latency distribution, retransmission behaviour, error-code mix and dialogue completion — not from a device’s own self-report.

Because PX is derived from the wire rather than from element counters, it stays honest when a node is lying, and it works identically across vendors, across legacy and 5G, and across your roaming partners’ equipment.

Capabilities

Predictive detection

Heuristic rules and trained models flag drift — rising retransmissions, shifting error-code mix, latency tail growth — in the window before subscribers notice.

Root-cause context

Every alert arrives with the dialogue sample, the peer, the route and the correlated transactions. The first engineer to look already has the trace.

Multi-protocol, one pipeline

Legacy SS7 and 5G service-based interfaces decoded by the same engine, onto the same timeline. Migration periods stop being blind spots.

Roaming and interconnect

Per-partner PX scoring turns interconnect disputes into evidence: which partner, which prefix, which hour, which failure mode.

Lightweight footprint

A fraction of the rack space, power and licence cost of a traditional probe estate. Commodity servers or your existing Kubernetes cluster.

Open by default

Prometheus, Kafka, SNMP, syslog, REST. Your data leaves in a format your other tools already read, and it stays yours.

Deployment models

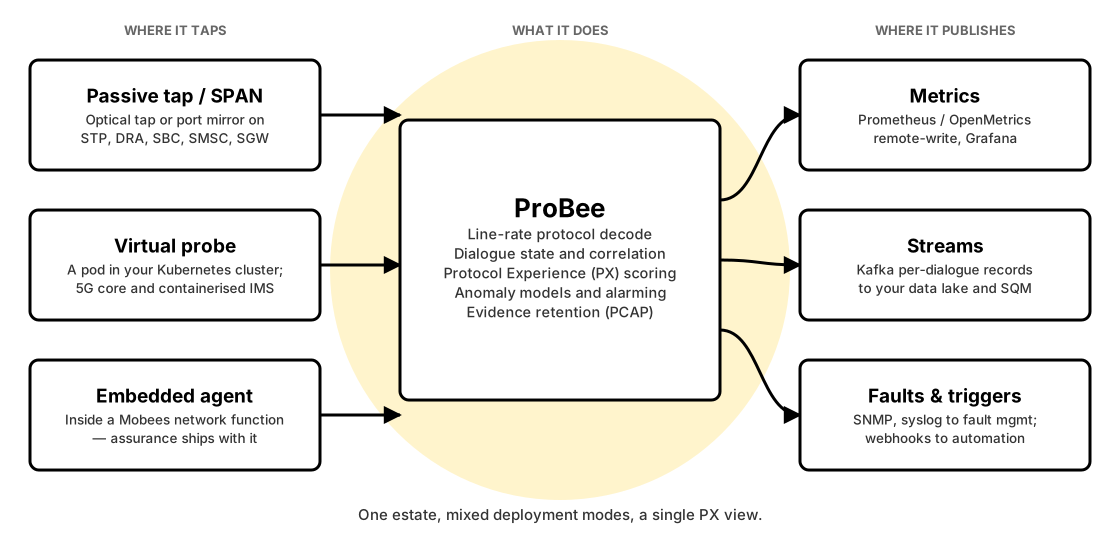
Tap / SPAN collector. Passive optical tap or switch port mirror on STP, DRA, SBC, SMSC or SGW links. Zero traffic impact, no change to the production path.

Virtual probe. A pod in your Kubernetes cluster reading service-mesh or CNI traffic — the model that fits 5G core and containerised IMS.

Embedded agent. Co-located with a Mobees network function (SMSC, MMSC, RBM GW, Entitlement Server), so those services ship with assurance built in rather than bolted on.

Hybrid. Most production estates mix all three, aggregated into one PX view.

ProBee deployment models

What changes when you deploy it

ProBee is bought for one of four reasons. Most customers arrive with the first and stay for the other three.

Incidents detected before the complaint queue

Degradation is visible while it is still degradation. The mean time to detect moves from “when customers call” to minutes.

Shorter time to resolve

The trace, the peer and the failing transaction type are attached to the alert. Engineers stop reproducing the problem before they can fix it.

Fewer customer complaints

Problems that used to be found by subscribers are found by the probe. Care volume follows.

Lower assurance cost

A credible alternative to heavyweight probe estates at a materially lower total cost, on an OPEX model.

Who runs ProBee

Operators who need protocol-level truth, and the platforms that serve them.

Tier-1 and Tier-2 MNOs

Core network and service assurance teams that need visibility below the KPI layer, across mixed-vendor and mixed-generation estates.

MVNEs and MVNOs

Per-tenant PX evidence for the SLAs you sell, and independent visibility into the host network you depend on.

OSS vendors and integrators

A protocol-level data source to feed performance, fault and service quality management — without building probe engineering in-house.

Messaging and RCS providers

SMPP, MM4 and RBM traffic quality per aggregator, with the evidence to back a commercial conversation.

What our customers say

References are anonymised at the customer’s request. Named references and written reference letters are available under NDA.

Core network operations, Tier-1 MNO (DT group)

„We were finding signalling degradations from the complaint queue. ProBee moved that left by roughly forty minutes — we now see the retransmission pattern build before the first customer calls. It is the same Grafana our NOC already lives in, so nobody had to learn a new console.”

Head of Platforms, MVNE serving 300k+ subscribers

„Our BSS was complete and our network layer was not. Mobees dropped in the messaging core and the TS.43 entitlement server behind our existing provisioning, per tenant. We stopped referring those deals out.”

Delivery director, systems integrator, CEE

„They are the people we call when a transformation programme hits SS7 or CAMEL and the schedule is already tight. Small team, no layers, an answer the same week.”

See ProBee on your own traffic.

We run a fixed-price proof of concept on one tap point. You keep the dashboards and the data whatever you decide afterwards.