ProBee northbound interfaces

ProBee in your stack Assurance Integrations

ProBee is a data source, not a destination. It was built on the assumption that you already own an assurance platform, a data lake and an automation layer — and that the last thing you need is another console competing with them.

  • Open, documented, standards-aligned interfaces — no proprietary collector
  • Metrics, streams, faults and service-quality feeds, all from one probe estate
  • Data models shaped for TM Forum-aligned performance, alarm and quality management
  • Designed to close the loop: machine-readable evidence, not just a red light
  • You keep the cockpit, the data and the vendor choice

Prometheus

OpenMetrics

Kafka

Avro / JSON Schema

SNMP v2c/v3

syslog RFC 5424

REST / JSON

TM Forum-aligned models

Grafana

OpenTelemetry

Webhooks

Kubernetes operator

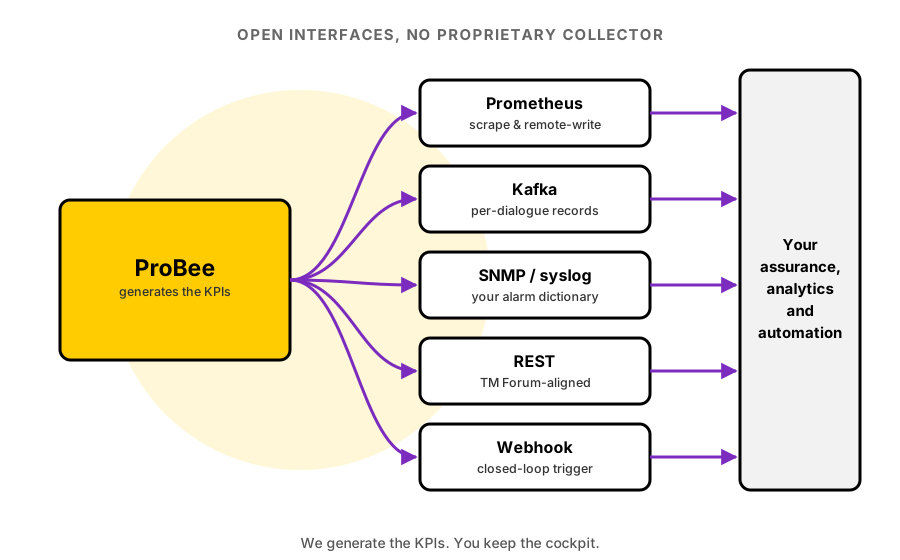
We generate KPIs. Your platform consumes them.

Assurance platforms are excellent at correlation, service modelling, SLA management and workflow. They are only as good as the measurements underneath them — and in most networks those measurements come from the elements themselves, which means they stop being trustworthy exactly when you need them most.

ProBee supplies an independent measurement taken from the wire. It does not compete with your service quality management, your performance management or your fault management. It gives all three something better to work with, and it gives your automation a signal that is specific enough to act on without a human in the loop.

That is the whole design philosophy: be the best possible input to somebody else’s closed loop.

Northbound interfaces

Everything below is available on every ProBee deployment. Nothing is a chargeable connector.

InterfaceProtocolTypical consumerContent
Metrics scrapePrometheus / OpenMetrics over HTTPSPrometheus, Thanos, Mimir, VictoriaMetrics, performance managementPX scores, success ratios, latency histograms, per peer / node / service
Metrics pushPrometheus remote-write, InfluxDB line protocolCentral TSDB, data lake ingestionSame series, pushed where scraping is not possible
Event streamApache Kafka, schema-registered Avro or JSONData lake, SQM, analytics, AI/ML pipelinesPer-dialogue records, anomaly events, correlated transaction sets
Fault feedSNMP v2c/v3 traps, syslog RFC 5424Fault management, umbrella NMSAlarms mapped to your alarm dictionary, with probable cause and evidence ref
Service qualityREST / JSON, TM Forum-aligned payloadsService quality management, SLA reportingService-level PX, threshold state, degradation intervals
Closed-loop triggerWebhook, Kafka command topicOrchestration, intent engines, automation frameworksMachine-readable anomaly with scope, confidence and supporting trace
Evidence retrievalREST / JSON, PCAP exportEngineering, dispute handling, regulatoryThe packets behind any metric, retained per your policy
DashboardsGrafana provisioning API, dashboards as codeExisting Grafana estateProBee dashboard pack, importable and forkable

Aligned with the models your platform already uses

We did not invent a data model. ProBee publishes into the shapes that TM Forum-aligned OSS platforms already expect, so mapping is configuration rather than a development project.

Performance management

PX and its component measures are exposed as named measurement types with defined collection intervals, granularity periods and object scopes — the structure performance-management APIs expect.

Alarm and fault management

Anomalies are emitted as alarms with perceived severity, probable cause, specific problem, alarmed object and a correlation identifier that survives into your trouble-ticket flow.

Service quality management

Service-level PX maps onto service-quality objectives and thresholds, so an SQM platform can drive conformance reporting without a bespoke adapter.

Resource and topology

Probes, links, peers and network functions are published as resources with stable identifiers, so your inventory and your assurance data refer to the same objects.

Closing the loop

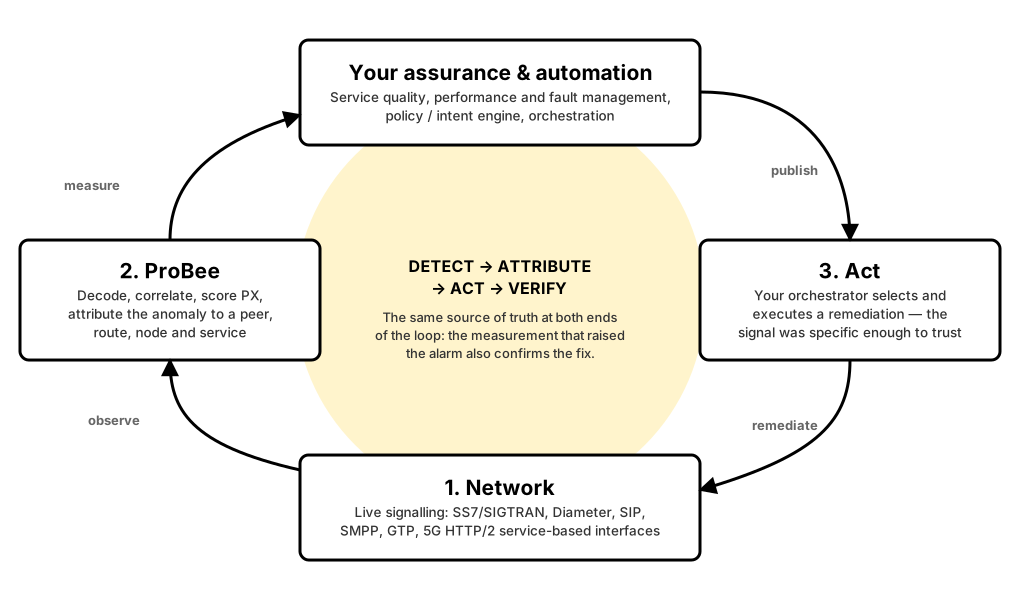
Autonomous and intent-driven operations fail for a boring reason: the input signal is not specific enough to act on. “Service quality degraded in region 4” is not something an orchestrator can safely remediate.

ProBee emits the other kind of signal. Each anomaly carries the affected service, the affected peer or route, the failure mode, a confidence score and a pointer to the supporting packets. That is enough for a policy engine to select a remediation, execute it, and verify the result against the same measurement that raised the alarm.

Detect → attribute → act → verify, with the same source of truth at both ends of the loop. We supply the two ends that touch the network; your automation owns the middle.

Closed-loop assurance with ProBee

For OSS/BSS vendors and system integrators

If you sell an assurance, analytics or automation platform, ProBee is a component you can put underneath it — under your brand, in your catalogue, on your paper.

No portfolio overlap

We do not build OSS or BSS. No service catalogue, no billing, no order management, no cockpit. Your account is not at risk from us.

White-label ready

Rebrandable dashboards, documentation and alarm dictionaries. Your customer sees your platform with better data in it.

L3 behind you

You keep the customer relationship and the first two support lines. We sit behind you as the protocol escalation tier.

Joint pilots

A six-week paid pilot at one shared account, with success criteria agreed in advance, is how every one of these relationships has started.

Send us your interface spec.

Tell us what your platform ingests and we will tell you, in writing and within a week, exactly how ProBee feeds it.